


本文发布初衷为追踪最新研究进展并分享给更多的研究者参考,如若侵犯到原作者或者其他单位任何相关利益,请告知删除!发布过程存在不准确或表述不清,以及任何疏漏,欢迎大家后台/邮件(2930832789@qq.com)留言指正或者删除。谢谢!
土壤有机质 (SOM) 是地球上最大的陆地有机碳库,SOM 动态对全球碳循环有重大影响。SOM 对土地管理和气候变化敏感,而SOM 库显著影响土壤健康、农业生产力和气候稳定性。然而,关于 SOM持久性和损失的机制仍然不确定。微生物是 SOM 分解、稳定和矿化的主要驱动因素,土壤微生物在控制全球 C 通量方面发挥着关键作用,但决定 SOM 动态的微生物机制仍不清楚。
2021年11月23日,权威综合学术期刊PNAS刊发相关研究论文,康奈尔大学Daniel H. Buckley为论文通讯作者,博士生Samuel E. Barnett为论文第一作者,论文题目:Multisubstrate DNA stable isotope probing reveals guild structure of bacteria that mediate soil carbon cycling。
作者采用了多底物、DNA 稳定同位素探测实验示踪不同生物可利用度、不同来源碳的细菌同化过程。这种方法使我们能够通过测量不同微生物相互作用的碳同化动力学来测量微生物对 SOM的贡献。作者鉴定了 1,286 个细菌类群,它们在 48 天的时间里同化了农业土壤中的 13C。细菌类群的整体 13C 同化动力学受13C的来源和时间影响,表现出低系统发育保守性。因此确定了由具有相似 13C 同化动力学的分类群组成结构。碳源生物利用度解释了碳矿化动态和群落结构的显著变化,并且细菌生长动态因碳添加而显著不同。微生物结构解释了大陆和全球范围内细菌生物地理分布的变化。因此,可见,了解原位生长动态对于了解微生物对土壤碳循环的贡献至关重要。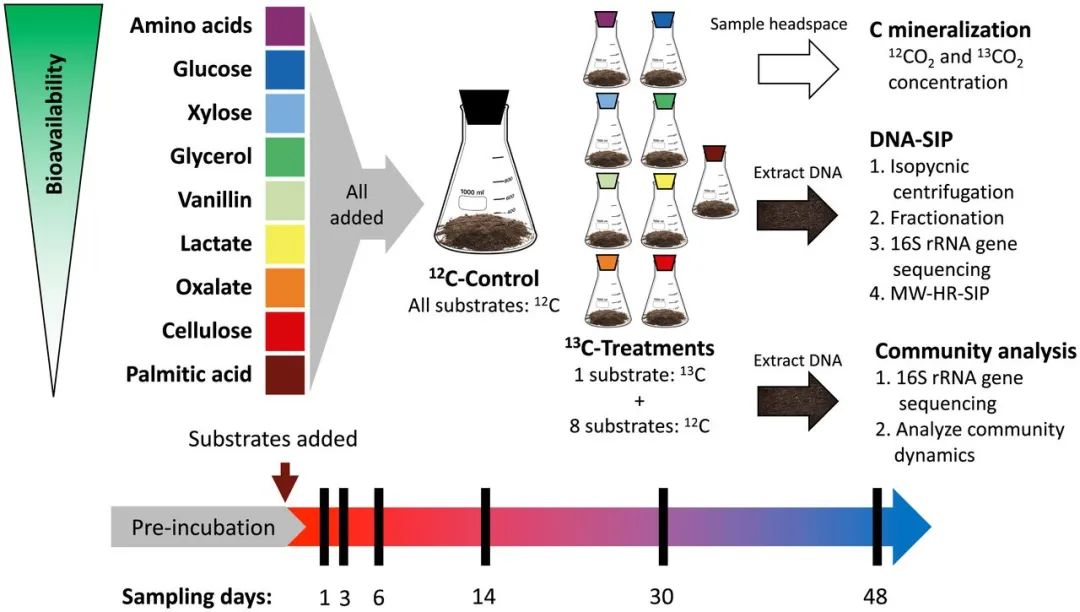
图1. 实验设计和流程
This experiment employed soil microcosms, each amended with all nine C sources (added at 0.4 mg C per gram of soil), only one of which was >99% 13C-labeled in treatment microcosms. Control microcosms had all nine C sources added but none were isotopically labeled. Microcosms were destructively sampled at multiple time points (black bars) based on mineralization rates from preliminary experiment. Headspace samples were taken every 1 to 7 d. DNA extracted from microcosm soil was used both for DNA-SIP and whole bacterial community sequencing (unfractionated).
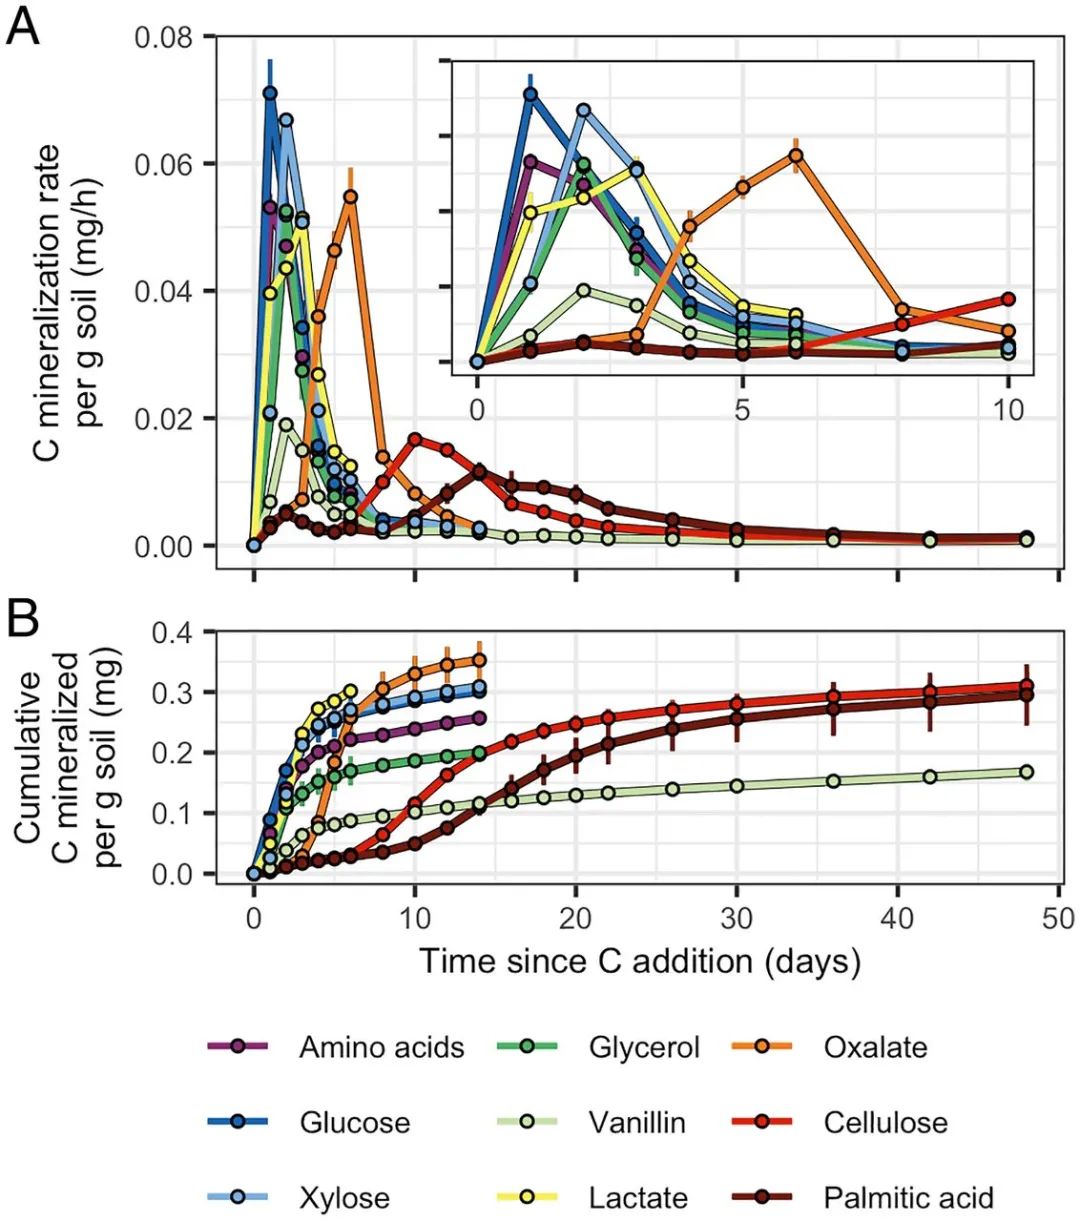
图2. C 源矿化动态
C source mineralization dynamics varied based on bioavailability. (A) 13C mineralization rates and (B) cumulative amounts of 13C mineralized per gram dry weight of soil. (A, Inset) A finer-scale representation of the 13C mineralization rates over days 0 to 10. Error bars represent ± SD among microcosm replicates (n = 3).
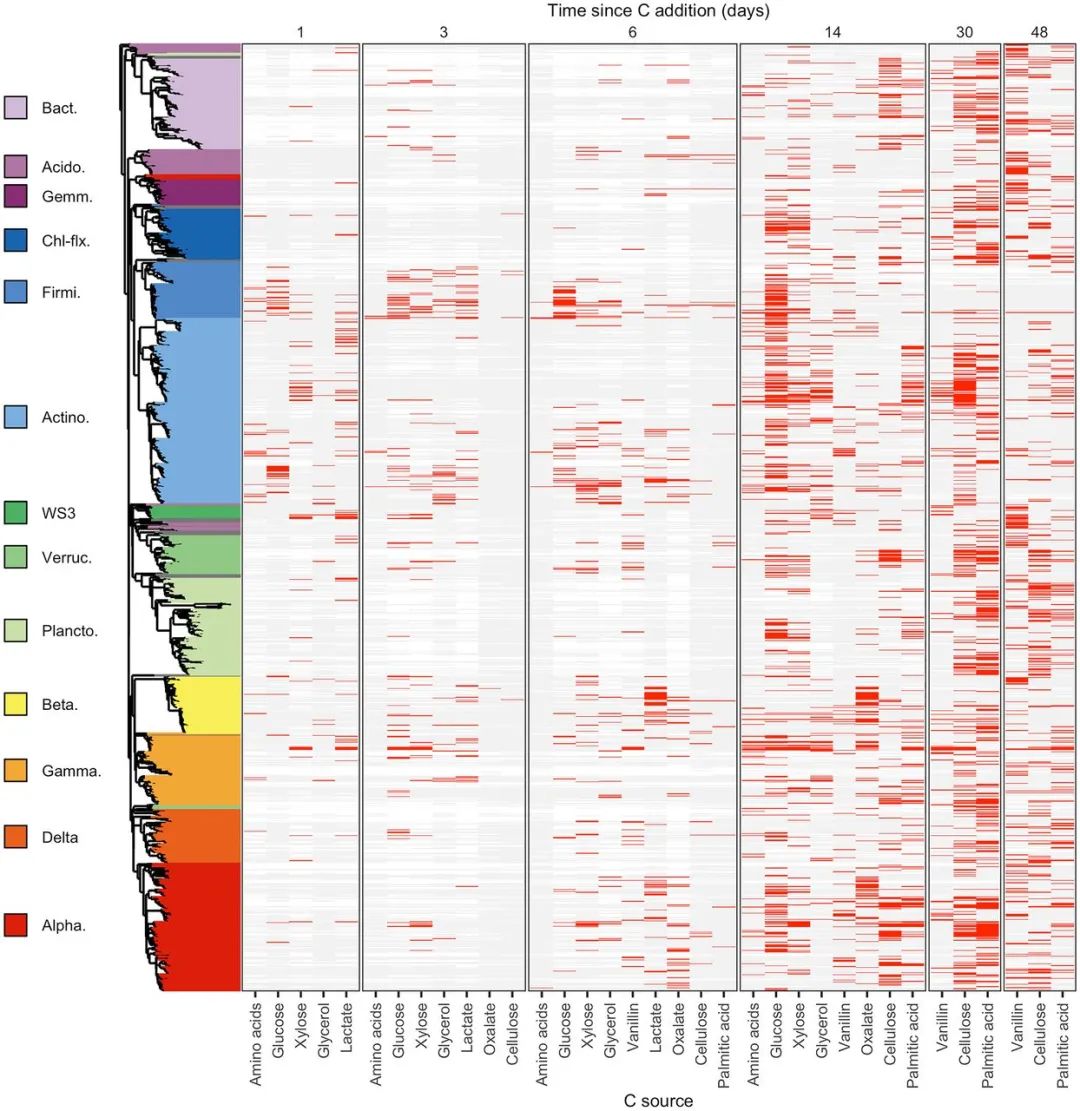
图3. 1,286 个 OTU 显著差异的 13C 标记特征
The dynamics of C assimilation varied across the 1,286 OTUs that exhibited significant 13C labeling. OTUs are ordered by their phylogeny with phylum, or class for Proteobacteria, indicated by different colors in the phylogenetic tree. Only phyla/classes with 10 or more 13C-labeled OTUs are colored, with others colored gray. Each vertical block indicates 13C-labeling results for a single day as specified at the top. Each column within a block indicates results for a given substrate as specified along the bottom. Rows display 13C-labeling dynamics for each OTU as follows: red bars indicate 13C-labeling, light gray bars indicate OTU detection in the gradient but no evidence of labeling, white indicates the OTU was not detected in the gradient. Phylum/class abbreviations: Bact. = Bacteroidetes, Acido. = Acidobacteria, Gemm. = Gemmatimonadetes, Chl-flx. = Chloroflexi, Firmi. = Firmicutes, Actino. = Actinobacteria, Verruc. = Verrucomicrobia, Plancto. = Planctomycetes, Beta. = Betaproteobacteria, Gamma. = Gammaproteobacteria, Delta. = Deltaproteobacteria, Alpha. = Alphaproteobacteria.
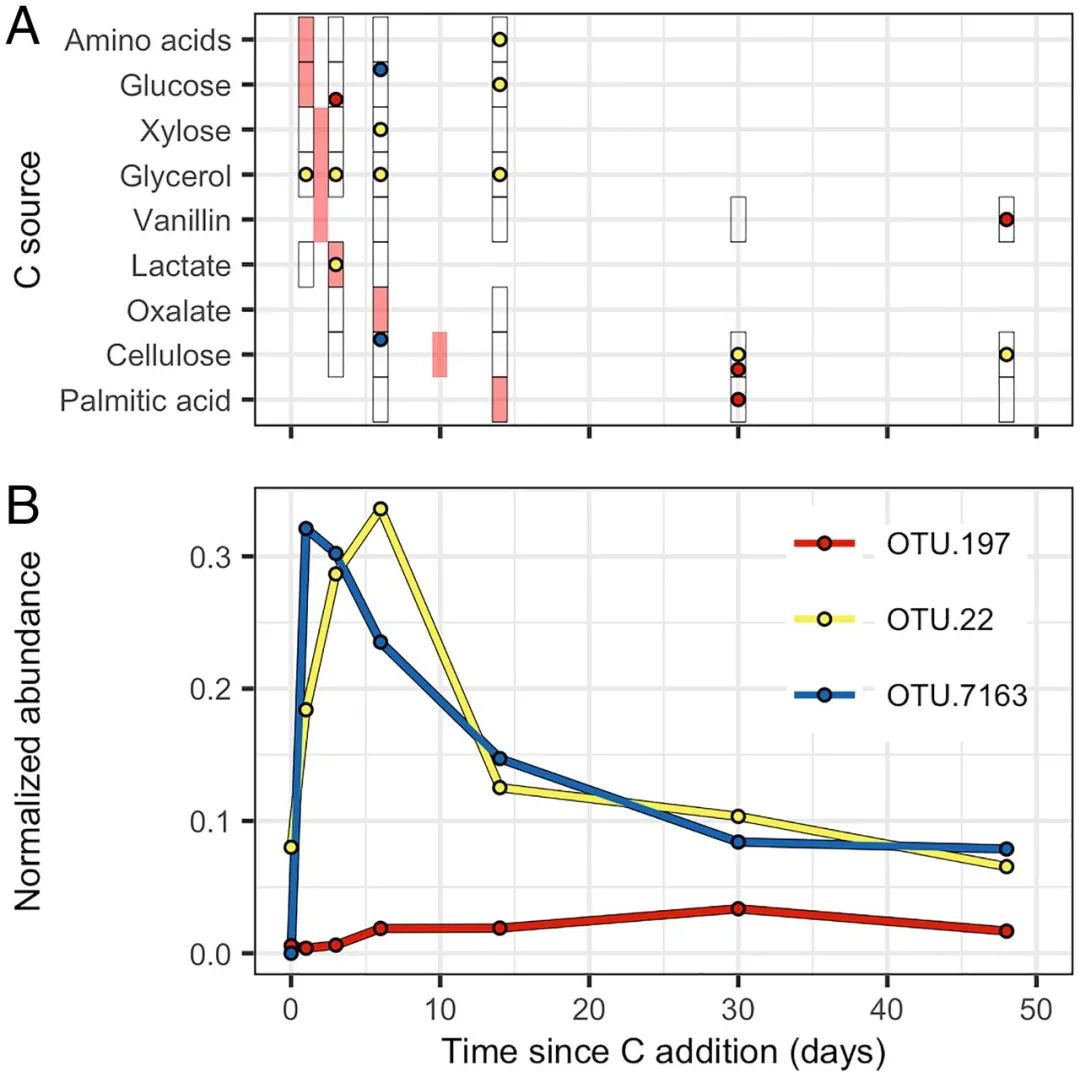
图4. 代表公会 2 (OTU.197)、14 (OTU.22) 和 19 (OTU.7163) 最丰富的 OTU 的生长和 13C 标记动态
Growth and 13C-labeling dynamics of the most abundant OTUs representing guilds 2 (OTU.197), 14 (OTU.22), and 19 (OTU.7163), which are the guilds most differentiated by PCA (Fig. 5E). (A) The 13C-labeling pattern differs between the three exemplar OTUs. Circles show times when 13C labeling was detected for each substrate and OTU responses are identified by circle color as defined in B. Black rectangles indicate the times when DNA-SIP was performed for each 13C-labeled substrate and red rectangles indicate the time of peak C mineralization for each C source (Fig. 2). (B) Growth dynamics differ between the three exemplar OTUs. Normalized abundance (expressed as micrograms of DNA) is calculated from relative abundance values normalized by rrn copy number and DNA yield.
仅供参考